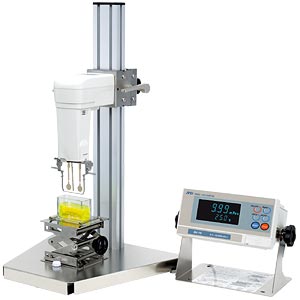
Product Features
- High Measurement Accuracy
- Wide Measurement Range
- Non-Newtonian Sample Viscosity Measurement
- Foam Sample Measurement
- Flowing Sample Measurement
| Models | Vibration Frequency | Measurement Range | Unit of Measure |
| SV-10 | 30Hz | 0.3 cP (mPa.s) ~ 10,000 cP (mPa.s) |
mPa.s, Pa.s, cP, P |
| SV-100 | 30Hz | 10 P ~ 1,000 P | Pa.s, P |
WinCT Viscosity
Via an RS232C interface, the WinCT-Viscometer software lets A&D’s SV series Sine-wave Vibro Viscometer display measurement progress in real time on a PC, and easily transmit the measured results to save or analyze. The WinCT-Viscometer CD-ROM is a standard accessory with the SV Series viscometer.
RsVisco, the graphing software utilized by WinCT-Viscometer, lets you create graphs of measured results and of the progress of viscosity measurement:
1. RsVisco creates the real-time graph of data received from A&D’s SV-series viscometer via RS-232C. RxVisco lets you graphically monitor in real time:
- Progress of change in viscosity during measurement
- Temperature data
- Temperature and viscosity, graphed together
2. You can choose from three types of graphs:
- Viscosity (Y axis) – Time (X axis)
- Viscosity/Temperature (Y axis) – Time (X axis)
- Viscosity (Y axis) – Temperature (X axis)
3. Graphs can be overlaid in repeating measurements, in 10 colors.
4. Measured data can be saved in a CSV format file.
5. Displayed graphs can be printed with a printer via a PC
